This is an open-access article distributed under the terms of the Creative Commons Attribution License, which permits unrestricted use, distribution, and reproduction in any medium, provided the original work is properly cited.
Purpose: A dose tracking software was recently in¬stalled in our CT department. The study aimed at eval-uating the software capabilities and staff performance in every day routine. Material and Methods: A dose tracking software was connected to a 64-slice CT scanner. All technical and dosimetric data of 6,010 CT examinations were ana¬lysed. Organ doses estimated by the software were also evaluated. Results: The software provided easy and quick statisti¬cal overview of clinical and technical data. Typical lo¬cal doses were comparable to national and internation¬al data. Organ doses proved to be an instrumental and supportive tool in individualised patient dosimetry. Conclusions: The software offered easy and quick statis¬tical overview of all CT clinical and technical data and a valuable overview of workload statistics, which occa¬sionally required discussion with the staff and, in some cases, corrective actions. It easily provided the time pe¬riods the scanner was not in use, and facilitated easy scheduling of routine quality control tests and other routine tasks in the department. A number of errors were identified and communicated to the staff; correc¬tive actions were taken.
CT is widely used in diagnosis of disease and has been identified as the major contributor to the collective radiation dose to population from medical exposures [1-7]. Depending on clinical needs and technical protocols, patient radiation dose differs, even for the same anatomical region, clinical indication, technical protocol and sometimes even for the same CT unit [8-12]. Furthermore, high rates of repeated CT scans are reported in the literature (such as in trauma patients) with additional hospital charges and additional radiation exposure [13]. The urge to monitor medical practices in CT scanner has risen significantly. The effective dose (E) for the most typical CT examinations varies tremendously even for the same technical protocol or the same CT scanner (1 mSv- 25 mSv) [8-23]. Therefore, the necessity of tracking patient dose data and CT scanning protocols is essential. It is worth noticing that CT radiation dose is linked to an increased risk of radiation-induced cancer [24-26].
To assess the radiation dose in CT, volumetric computed tomography dose index (CTDIvol), dose length product (DLP) and E are the most widely used radiation dose indices [8, 10, 27]. In order to optimise radiological practices more efficiently in terms of radiation dose, the term Diagnostic Reference Level (DRL) is defined both in the European [28] and International [29] Basic Safety Standards (BSS). It is also clearly stated that medical X-ray equipment must have a means to inform the practitioner of the relevant parameters for assessing the patient dose and, even more important, to have the capacity to transfer this information to the record of the examination [29].
Due to the upcoming implementation of the EU BSS [29], the need for an automated dose monitoring solution rises. This can be an extremely time consuming and complex task. Nowadays, sophisticated software packages with friendly interface can assist to this task, resulting in a much easier and quicker way to monitor all data included in the Digital Imaging and Communication in Medicine (DICOM) header of the CT scanner or data recorded in the Picture Archiving and Communication System (PACS) of the hospital [30-37]. These studies focus on radiation dose data analysis.
One of the commercially available dose tracking software was recently installed in our CT department. Our study focused on evaluating the software features and capabilities and on assessing staff performance in every day routine. It also investigated whether the system can be used solely for patient radiation dose analysis, or could also assist in the general management of the CT department.
2.1 CT scanner and dose tracking software system
A dose tracking software (DOSE, Qaelum, Belgium) was recently connected to a Philips Brilliance 64 CT scanner (Philips Systems, the Netherlands), installed in 2013 in Konstantopoulio General Hospital in Athens, Greece. This is a software tool that has the capability to connect with a variety of medical ionising and non-ionising radiation units that are available in a hospital and to combine all available data into a single configuration where every examination is analysed and archived. The configuration provides a direct overview and makes information available at any time for all users, depending on their level of authority. Although initially intended to be connected to a number of X-ray modalities such as an angiography system, an older four (4) slice CT scanner and certain computed radiography systems, this could not be done in real practice. This was due to the fact that these devices are old and they could not export dose data in the DICOM formats that the software supports. It must be noted that our hospital does not have a PACS system and therefore the software was connected directly to the Philips 64-slcie CT scanner.
2.2 Technical factors and dosimetric quantities collected
For each examination, the tube voltage (kV), tube output (mAs), Field of View (FOV), pitch, collimation, number of slices, series information, scanogram and operator’s name are examples of clinical data that can be recorded. Regarding radiation dose metrics, CTDIvol and DLP are the dosimetric quantities transferred from the CT scanner to the software workstation. The software uses the patient CT exam data and calculates E and organ doses. Organ doses are estimated using conversion factors derived from Monte Carlo simulations for a standard-size model. More specifically, the conversion factors are derived by an in-house Monte Carlo simulation model that has been developed based on vGate simulation tool. A reference adult phantom from the phantom library of MIRD is used for the simulations. The model calculates the organ doses for every body part examined according to typical z-ranges. Specifically, for every organ, dose profiles are generated. Simulated scans are performed per 1 cm in the z-direction forvarious photon energies up to 140 keV obtained by combining different energy values according to the realistic spectrum for a given tube voltage. For organs away from the scan range, extrapolation of sparse data is performed. Organ doses are derived by adding the values of the dose profile over the typical z-range (determined by typical examination types). The validation of the in-house model was already performed against commercially available dosimetric tools before the study to ensure accuracy of organ dose estimation [38].
2.3 Patient sample
The study included 6,010 CT examinations from 13th March 2016 to 14th March 2017. The study was performed according to the ethical standards as described by the Declaration of Helsinki. Initially an overall evaluation of all CT examinations and utility of the software was performed. Then a more focused analysis was performed for the most frequent CT exams independently of clinical indication. Due to the higher radiosensitivity of organs in examinations of the trunk, the authors decided to focus on these exams for further analysis. In order to estimate organ doses, the examinations were divided in 3 broad anatomical part categories: Chest, Abdomen and Chest/Abdomen/Pelvis (CAP) CT examinations.
3.1 Overall evaluation
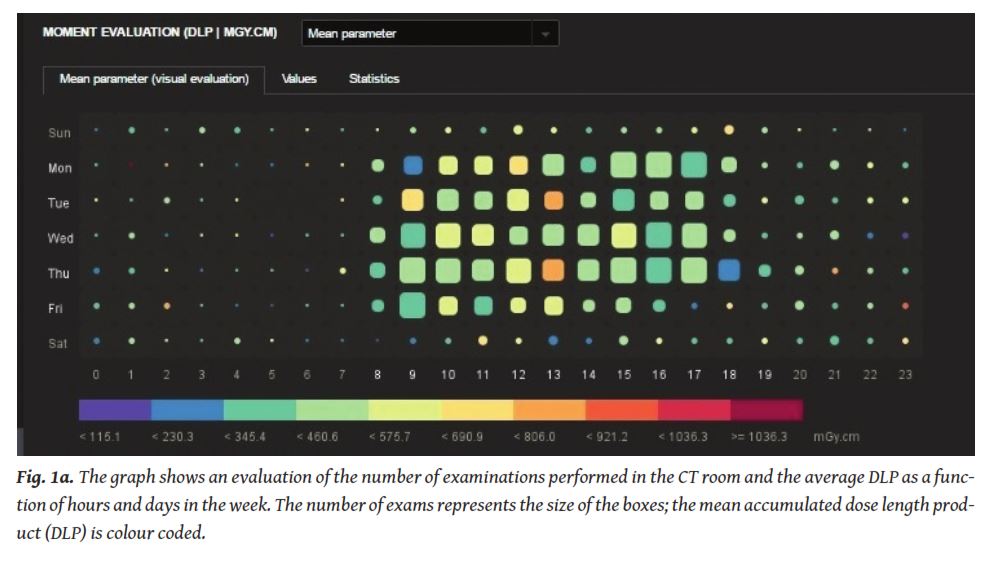
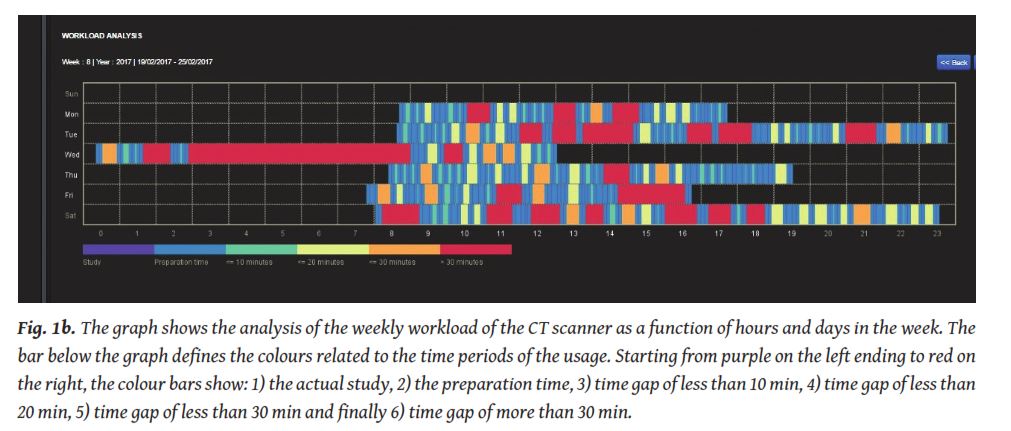
The percentage of men and women were 41% and 59%, respectively. The software offered easy and quick statistical overview of all clinical and technical data of CT examinations. This overview could be provided for a specific date, for a time period within the day, or for a whole date range selected by the user. An example of this workload overview can be seen in
The software allowed evaluation of patient demographics, in multiple ways depending on the operator or hospital management needs.
As far as technical protocols and parameters used are concerned, a very large variability of CT protocols was noticed. Forty six (46) different scanning protocols were recorded for 16 different anatomical regions. These protocols are related both to anatomical region and clinical indication. It must be noted that effective dose and organ doses estimation are related to anatomical region and not clinical indication. The analysis revealed mistakes in the technique mainly related to the technical protocol (extra image series, longer scans than actually needed, wrong protocolused, or even choosing the correct protocol but typing the wrong name). All these errors were communicated to the operators and helped in the optimisation of procedures and better organisation of the department.
2 Dose evaluation
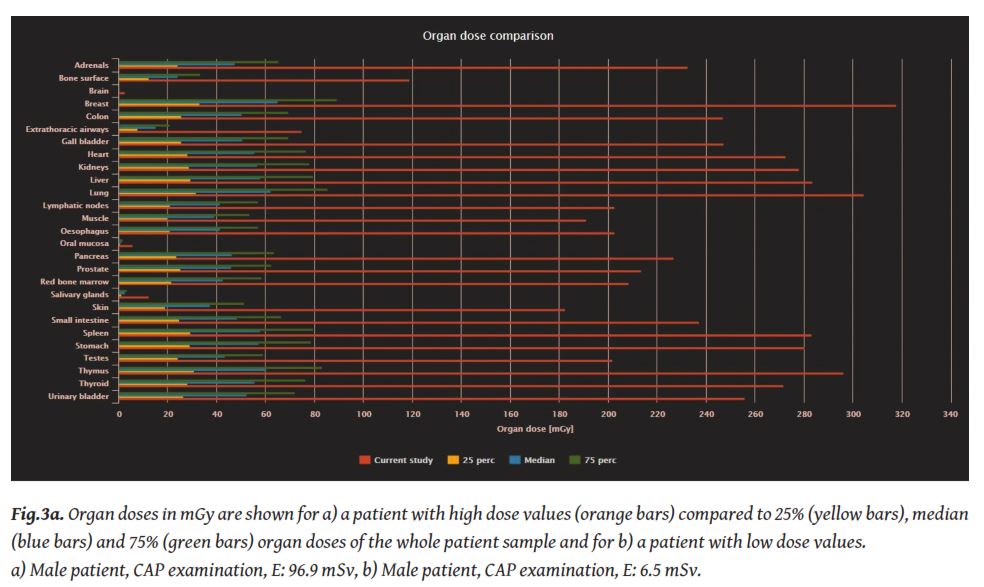
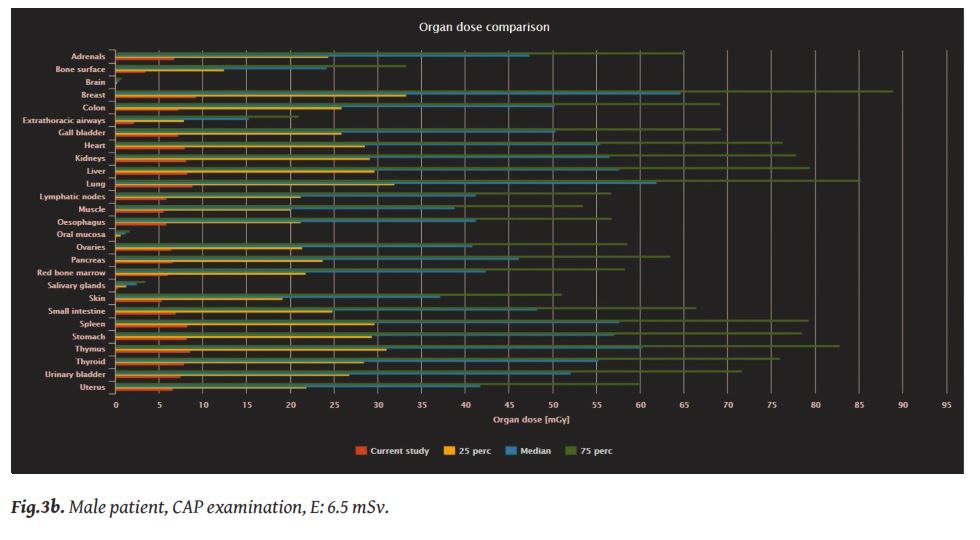
The software also offers individual organ doses (mGy) estimation in routine basis. Apart from individual patient organ doses, the software calculates the 25 percentile, median values and 75 percentile for the organ doses. There is also the possibility to calculate these values for the whole sample of patients or apply a filter based on the specific body part or the same description of the examination. An example is given in
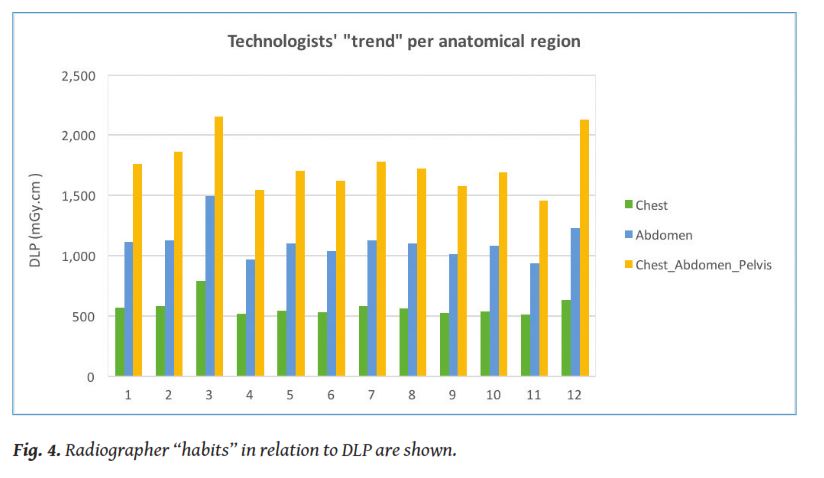
DLP is the dose value that represents more efficiently the differences between radiographers due to the differences in scan length (
4. Discussion
The dose management system proved to be an effective, powerful tool that facilitated the evaluation of general practice and workflow of the CT department and revealed the habits of operators, so that corrective actions are made for the benefit of the patient. Before installing the software, analysis of data was a cumbersome process that required manual entry of values, with significant outflow of resources and the risk of typing errors. The fact that all these had to be done manually patient by patient was the main reason why it could not be done in a systematic way.
One could argue that the implementation of a dose management system is a cost for the hospital, especially with the current financial situation in Greece. This cost, which usually increases with the number of X-ray devices or examinations performed, includes not only the installation but also the maintenance. However, the gain of the hospital is also important. In this study, we highlighted some parts of the benefit, mostly in terms of improvement of workload, personnel efficiency and patient dose evaluation. As far as radiation doses are concerned, assessment of examination doses in terms of CTDIvol and DLP for a certain number of patients is presented and discussed extensively in the international literature for at least 20 years. The use of the dose tracking tool to evaluate the whole sample and not only a limited number of patients helped to easily identify weaknesses and mistakes in our every day routine. The immediate estimation of E and organ doses proved to be a valuable tool in this process. It allowed us to take a deep dive into the patient data for optimisation of safety, quality, training and practice of the department.
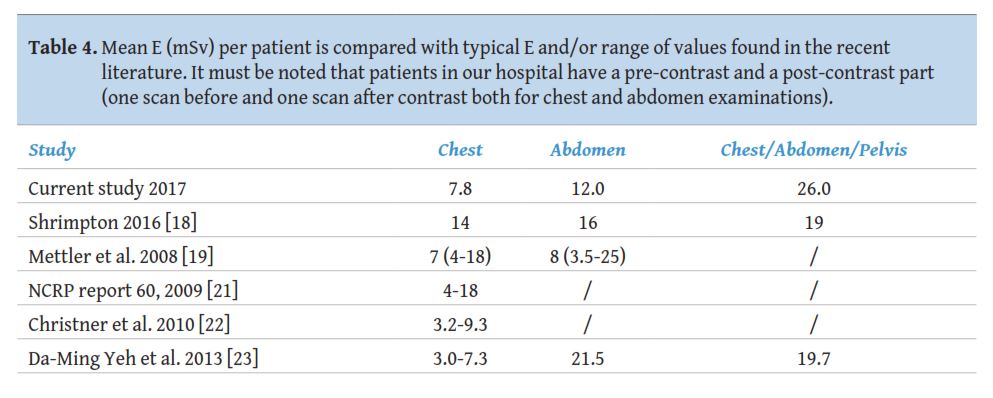
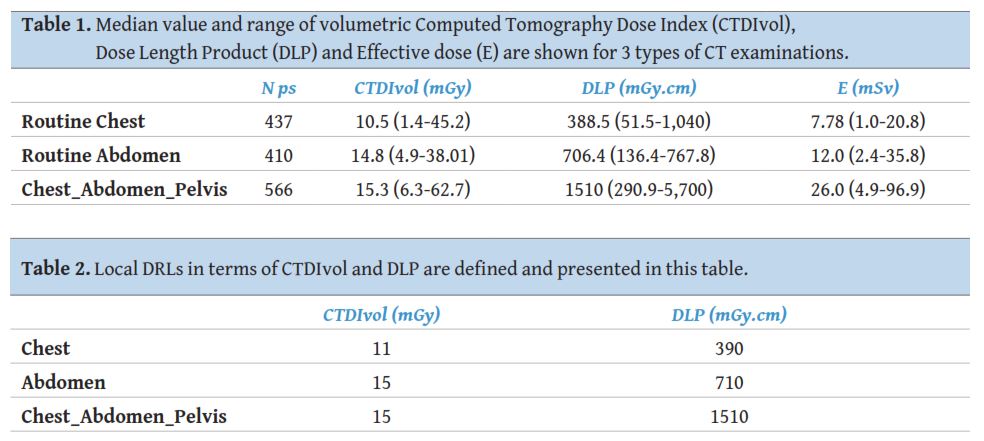
The traditional estimation of average CTDIvol, DLP and E and comparison with national or international values seems no longer relevant, if one considers the numerous and very different technical protocols applied for different clinical indications for the same anatomical region. Furthermore, the number of scanning phases depends also on the clinical indication which is basically the main determining factor of radiation dose. Various clinical indication–specific CT technical protocols have been developed to help tailor CT dose and image quality on the basis of specific clinical indications. It seems essential to define diagnostic reference levels for each of these clinical indications for more accurate comparison of practice

1.Mori S, Endo M, Nishizawa K, et al. Comparison of patient doses in 256-slice CT and 16-slice CT scanners.Br J Radiol2006; 79: 56–61.
2.Silverman JD, Paul NS, Siewerdsen JH. Investigation of lung nodule detectability in low-dose 320-slice computed tomography.Med Phys2009; 36(5): 1700-1710.
3.Kalra MK, Woisetschläger M, Dahlström N, et al. Sinogram-affirmed iterative reconstruction of low-dose chest CT: Effect on image quality and radiation dose.AJR Am J Roentgenol2013; W235-W244.
4.Gaztanaga J, Garcia MJ. New noninvasive imaging technologies in coronary artery disease.Curr Cardiol Rep2009; 11(4): 252-257.
5.Pauls S, Gabelmann A, Heinz W, et al. Liver perfusion with dynamic multidetector-row computed tomography as an objective method to evaluate the efficacy of chemotherapy in patients with colorectal cancer.Clin Imaging2009; 33(4): 289-294.
6.Türkvatan A, Olçer T, Cumhur T. Multidetector CT urography of renal fusion anomalies.Diagn Interv Radiol2009; 15(2): 127-134.
7.Flor N, Zuin M, Brovelli F, et al. Regenerative nodules in patients with chronic Budd-Chiari syndrome: A longitudinal study using multiphase contrast-enhanced multidetector CT.Eur J Radiol2010; 73(3): 588-593.
8.International Commission on Radiological Protection (ICRP). Managing patient dose in multi-detector computed tomography (MDCT).Annals of the ICRP102, 2007. V 37/1, Elsevier.
9.Shrimpton PC. Protection of the patient in X-ray computed tomography.Documents of the National Radiological Protection Board (NRPB)1992; V 3, N 4 Chilton: NRPB.
10.Baert AL, Knauth M, Sartor K. Radiation dose from adult and pediatric multidetector computed tomography.Springer, 2007.
11.Tsalafoutas IA, Tsapaki V, Triantopoulou C, et al. CT guided interventional procedures: Patient effective and skin dose considerations.AJR Am J Roentgenol2007; 188: 1479–1484.
12.Mayo-Smith WW, Hara A, Mahesh M, et al. How I do it: Managing radiation dose in CT.Radiology2014; 273(3): 657-672.
13.Jones AC, Woldemikael D, Fisher T, et al. Repeated computed tomographic scans in transferred trauma patients: Indications, costs, and radiation exposure.J Trauma Acute Care Surg2012; 73(6): 1564-1569.
14.United Nations Scientific Committee on the Effects of Atomic Radiation (UNSCEAR) 2008. Report to the General Assembly, V I: (Sources) Report to the General Assembly, Scientific Annex A, United Nations, New York, 2010.
15.Griffey RT, Sodickson A. Cumulative radiation exposure and cancer risk estimates in emergency department patients undergoing repeat or multiple CT.AJR Am J Roentgenol2009; 192(4): 887-892.
16.Tsapaki V, Rehani M. Dose management in CT facility.Biomed Imaging Interv J2007; 3(2):e43.
17.Report of American Association of Physicists in Medicine (AAPM) Task Group 23. CT Dosimetry: The measurement, reporting, and management of radiation dose in CT.AAPM Report 96, One Physics Ellipse, College Park, 2008.
18.Shrimpton PC, Jansen JT, Harrison JD. Updated estimates of typical effective doses for common CT examinations in the UK following the 2011 national review.Br J Radiol2016; 89: 20150346.
19.Mettler FA, Huda W, Yoshizumi TT, et al. Effective doses in radiology and diagnostic nuclear medicine: A catalog.Radiology2008; 248: 254–263.
20.McCollough CH, Bushberg JT, Fletcher JG, et al. Answers to common questions about the use and safety of CT scans.Mayo Clin Proc2015; 90(10): 1380-1392.
21.National council on radiation protection and measurements (NCRP). NCRP Report No. 160 - Ionizing radiation exposure of the population of the United States, Bethesda, MD, USA, 2009.
22.Christner JA, Kofler JM, McCollough CH. Estimating effective dose for CT using dose-length product compared with usingorgan doses: Consequences of adopting international commission on radiological protection publication 103 or dual-energy scanning.AJR Am J Roentgenol2010; 194: 881-889.
23.Yeh DM, Tsai HY, Tyan YS, et al. The Population effective dose of medical computed tomography examinations in Taiwan for 2013.Jagetia GC2016, ed. PLoS ONE. 11(10): e0165526. doi:10.1371/journal. pone.0165526.
24.Brenner DJ, Doll R, Goodhead DT, et al. Cancer risks attributable to low doses of ionizing radiation: Assessing what we really know.Proc Natl Acad Sci USA2003; 100: 13761-13766.
25.Brenner DJ, Hall EJ. Computed tomography-an increasing source of radiation exposure.N Engl J Med2007; 357: 2277-2284.
26.Brenner DJ. Should we be concerned about the rapid increase in CT usage?Rev Environ Health2010; 25(1): 63-68.
27.The 2007 recommendations of the international commission on radiological protection. ICRP publication 103.Ann ICRP2007; 37(2-4): 1-332.
28.European Council Directive 2013/59/Euratom on basic safety standards for protection against the dangers arising from exposure to ionising radiation and repealing Directives 89/618/Euratom, 90/641/Euratom, 96/29/Euratom, 97/43/Euratom and 2003/122/Euratom. OJ of the EU. L13; 57: 1-73 (2014).
29.Radiation protection and safety of radiation sources. International basic safety standards general safety requirements international atomic energy agency (IAEA) safety standards series No.GSR Part 3, Vienna, 2014.
30.Seuri R, Rehani MM, Kortesniemi M. How tracking radiologic procedures and dose helps: Experience from Finland.AJR Am J Roentgenol2013; 200: 771-775.
31.Duong PA, Little BP. Dose tracking and dose auditing in a comprehensive computed tomography dose-reduction program.Semin Ultrasound CT MRI2004; 35: 322-330.
32.Nicol RM, Wayte SC, Bridges AJ, et al. Experiences of using a commercial dose management system (GE DoseWatch) for CT examinations.Br J Radiol2015; 5: 20150617.
33.Hadid L, Waryn MJ, Brillet PY, et al. Impact of a dose-tracking software and iterative reconstruction technique on the optimisation of CT protocols. Application to the radiology department of the hospital group “Avicenne, Jean-Verdier, René Muret”.Physica Medica 2013; 29: e15.
34.De Bondt T, Mulkens T, Zanca F, et al. Benchmarking pediatric cranial CT protocols using a dose tracking software system: A multicenter study.Eur Radiol2017; 27 (2): 841-850.
35.Wang J, Molvin L, Marsh D, et al. A management tool for CT dose monitoring, analysis, and protocol review.Med Phys2014; 41: 558.
36.MacGregor K, Li I, Dowdell T, et al. Identifying institutional diagnostic reference levels for CT with radiation dose Index Monitoring Software.Radiology2015; 276 (2): 507-517.
37.Chatzoglou V, Kottou S, Nikolopoulos D, et al. Management and optimisation of the dose in computed tomography via dose tracking software.OMICS J Radiol2016; 5: 227. doi:10.4172/2167-7964.1000227.
38.https://qaelum.com/solutions/dose. Last assessed 27 November 2017.
39.European semester thematic fiche. Health and health systems. http//www. Ec.europa.eu/europe2020/ pdf/themes/2016/health_systems_201605.pdf (last assessesed 14 March 2017).
40.European Commission. Radiation protection 109. Guidance on diagnostic reference levels (DRLs) for medical exposures.Directorate-General, Environment, Nuclear Safety and Civil Protection, 1999.
None


